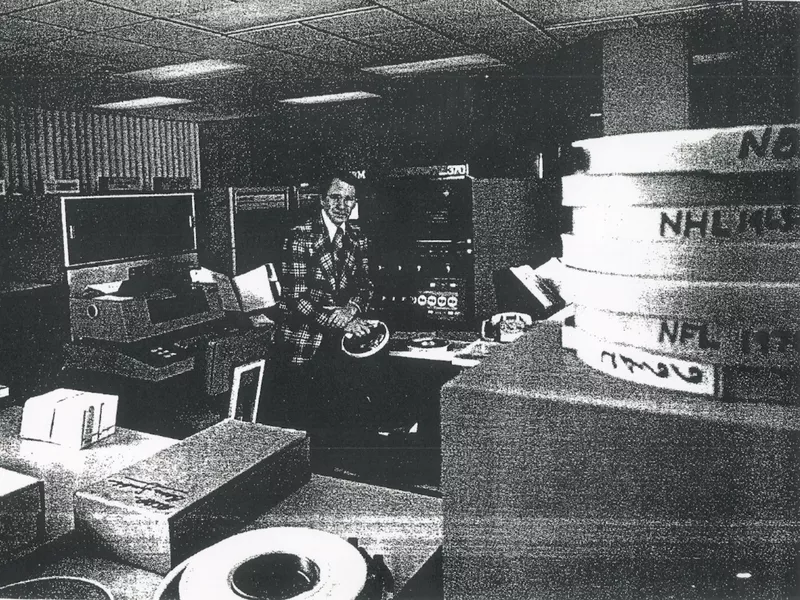
Bud Goode (pronounced “goody”), the father of pro football analysis, was a mathematician at heart who spent almost half a century collecting and analyzing football statistics. One sportswriter called him “a Hollywood press agent loose in a Twilight Zone of numbers.”
In 1973, he predicted the winners in 75 percent of the NFL games played. He often said he wanted the inscription on his headstone to read: “Here lies Goode. He told the world about average yards per pass attempt.” He died in 2010.
He may not have gotten his tombstone wish, but yards per pass attempt — today known as net yards per pass attempt, or NY/A — remains the most important stat in pro football.
Here’s everything you need to know about the metric to be an expert. Or at least impress your friends, family and coworkers.
12 Super Bowl Winners
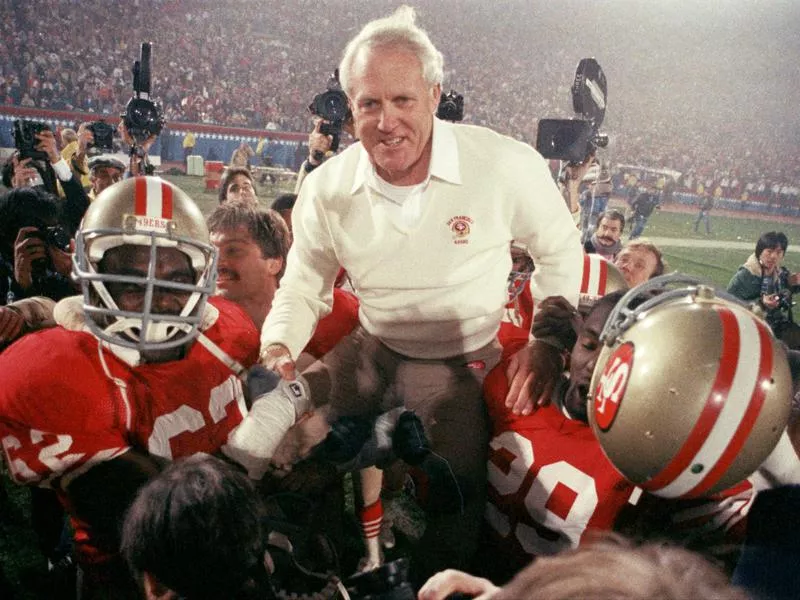
Head coach Bill Walsh, center, won three Super Bowls with the San Francisco 49ers and perfected the offensive schemes that became known as the West Coast offense. Here, he is hoisted on the shoulders of his team after they beat the Miami Dolphins 38-16 in Super Bowl XIX on Jan. 20, 1985, at Stanford Stadium, in Palo Alto, Calif. AP Photo
From 1985 through 2010, Goode did research for 26 NFL franchises, including 12 Super Bowl winners.
Among his most devoted followers were his first, George Allen (with both the Redskins and the Rams), Dick Vermeil, Bill Parcells and Bill Walsh.
All four took teams to the Super Bowl, and the last three coaches won.
How Often Does This Hold True?
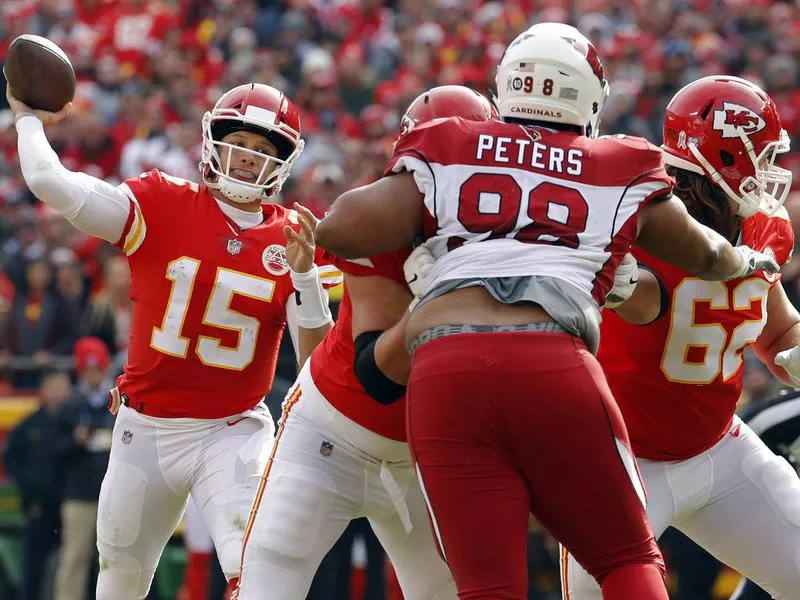
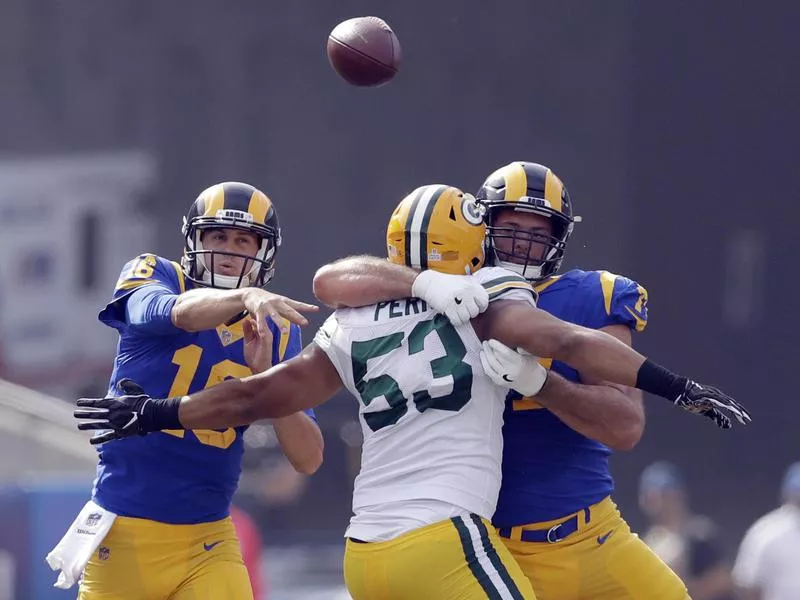
Kansas City Chiefs quarterback Patrick Mahomes ranks among the YPA leaders in 2018. Charlie Riedel / AP Photo
What’s the probability of yards per pass attempt determining final results?
If you want to impress your football friends, try this trick. Next Monday morning, ask someone to look at the NFL box scores. For each game, tell them not to tell you the teams or any other information except the number of net yards each team passed for, number of sacks and sack yardage, and the number of pass attempts.
With that alone, you can tell them who won the game four out of five times, or around 80 percent.
NY/A Over the Years
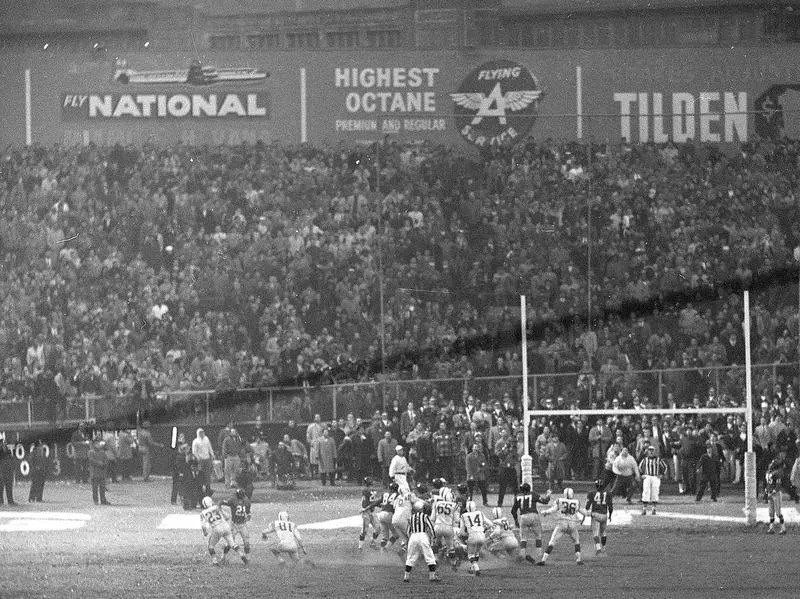
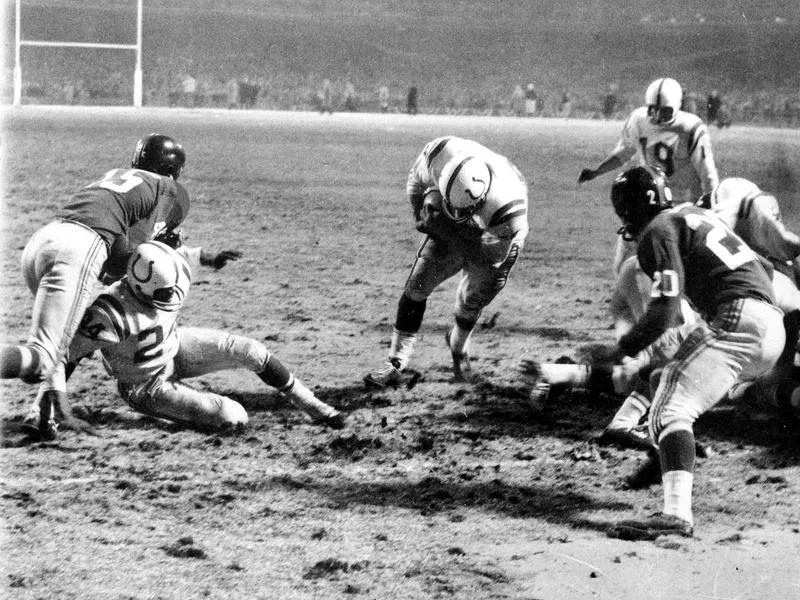
Baltimore Colts kicker Steve Myhra (65) makes a field goal with 10 seconds left in the 1958 NFL championship game against the New York Giants to tie the score at 17 and send the game into overtime at Yankee Stadium in New York City. The Colts won 23-17 to take the title in what is widely known as “The Greatest Game Ever Played.” AP Photo
In the 1990s, my colleague, statistician and economist George Ignatin, tested Goode’s theory all the way back to 1958, the year which many regard as the birth of the modern NFL, when Johnny Unitas led his Baltimore Colts to a thrilling sudden-death victory over the New York Giants in the championship game.
The NFL started keeping better and more comprehensive stats that year, so football was easier to study.
Since then, diligent stats gurus have poured over thousands of box scores and updated NFL stats back to 1932.
History Backs Goode Up
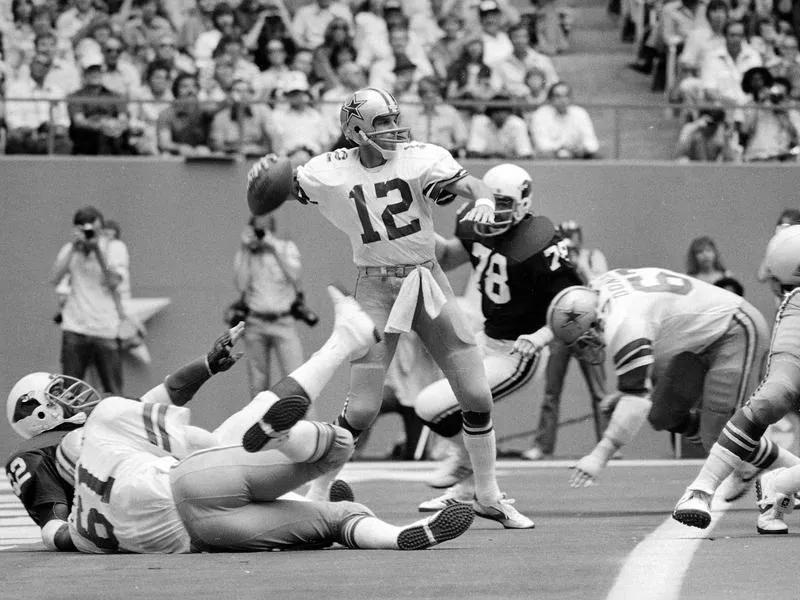
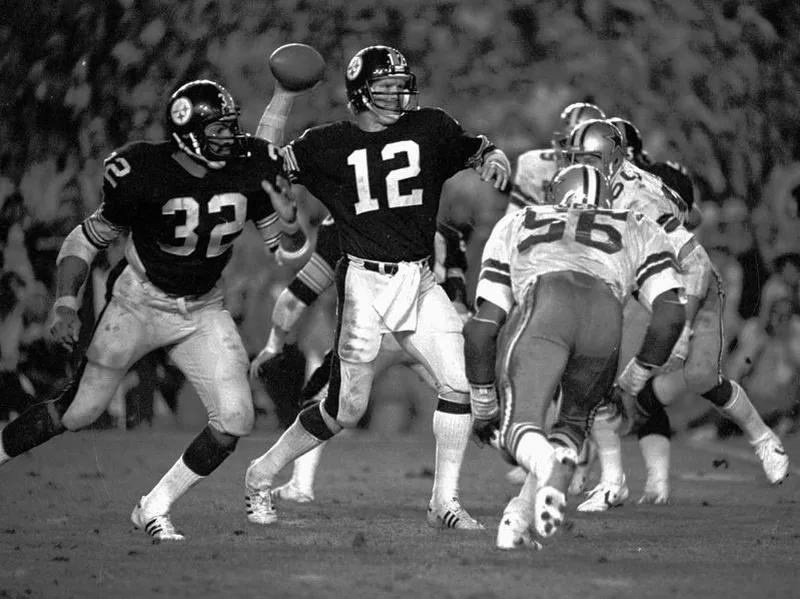
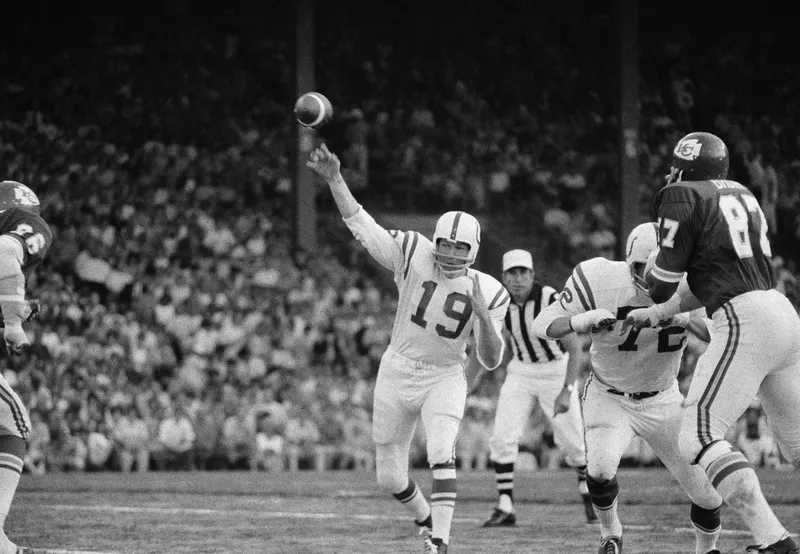
Dallas Cowboys quarterback Roger Staubach looks to throw a pass in a 1979 game against the St. Louis Cardinals in Dallas, Texas. AP Photo
Goode was absolutely correct: Pro football essentially was a game of passing and pass defense, and the best stat for measuring the effectiveness of the passing game was yards per pass attempt. In our study, the team that had the highest NY/A for that game won 83 percent of the time.
In 2008 we updated, and the margin had dropped slightly to 81.5 percent, which a statistician would call an acceptable statistical variation.
We did it again in 2015, and the wins rate was 81.8 percent.